Thursday, June 30, 2011

15. Weather Tracking and Forecasting

Photo 27: Infra Red Weather Map of Canada from the GOES-WEST Satalite.
Image from the Environment Canada weather website. 2011-06-30

Weather forecasting

Meteorology, the systematic study of short term weather phenomenon, has improved its science a lot over the last decennia. Yet during my visit to the Environment Canada office in Edmonton, I was surprised to see how much guesswork weather forecasting still is in this modern age. Meteorology is an art as well as a science.

Weather tracking


Canada has hundreds of weather stations, from which 290 have been around for more than 30 years already. They are the so-called climate stations, stations that have been around long enough to measure long-term climate patterns as well as current weather systems. Environment Canada also uses radiosondes, balloons with weather measuring equipment on board. Canada has 37 radiosondes stations, which measure twice daily (noon and midnight). Many current weather mapping is done with satellites. Polar orbiting satellites orbit around the earth at about 1100 km high and take images of the earth. Other satellites have a geosynchronous orbit, which means they hover above one spot on the Earth. GOES-11 (or GOES-WEST) and GOES-13 (or GOES-EAST) (Geostationary Orbiting Environmental Satellite) are two North-American satellites used for weather mapping. The textbook refers to GOES-10 and 12, but these ones are inactive according to the NASA website. During our fieldtrip to the Environment Canada office (photo 28) we saw many weather images including some images from the GOES-WEST Satellite (photo 27).


Photo 28: Environment Canada weather office. 2011-05-06

14. Severe Weather

Photo 25: Large rain cloud above our farm. 2005-09-02

Thunderstorms

Much about Thunderstorms is already in the Unit 12 post, but I will build a bit further on this phenomenon in this post. So, one aid for a thunderstorm is a warm summer season, maybe with a few heat waves (3 consecutive days of 32°C or higher). Another aid is abundant low-level moisture and a strong wind shear.

Thunderstorms come in 3 categories: single-cell, multi-cell, and super-cell thunderstorms. The air mass single-cell thunderstorm is discussed in the post on Unit 12. These storms dissipate quickly. Multi-cell thunderstorms often form in line (squalle-line storms). Super-cells are massive and might form in a large cluster of thunderstorms, but are usually single-celled.

A key factor in thunderstorm formation is lapse-rate. As I said in the post on Unit 5, the average lapse-rate is 6.5°C per 1000 meter; however, this may vary. The greater the lapse-rate is, the higher the thunderstorm will become. The purpose of a thunderstorm is heat transfer, from the surface upward. Thunderstorms often cause severe weather and great dramatic weather effects. Photo 25 shows dramatic weather effects alike; however, the unusual redness in the cloud is actually the setting sun. This picture looks worse than it is, unlike tornadoes.

Tornadoes

Like hurricanes and thunderstorms, tornadoes basically draw hot air from the Earth’s surface. In the case a tornado forms above the ocean, it is called a water spout. The tornado is closely related to a thunderstorm, because it often forms right underneath a thunderstorm. A tornado is a small vortex of air, from 100 m to 500 m in diameter, and can leave a trail of destruction up to 160 km long and 900 m wide. Tornadoes usually spin, but unlike hurricanes who are much larger and strongly affected by the Coriolis force, tornadoes spin due to internal forces, though often in the direction of the Coriolis force. Figure 26 shows the workings of a tornado as part of a thunderstorm. Very similar processes are going on compared to a thunderstorm: cold downdraft in the middle, and very strong hot updrafts reaching far into the Troposphere.


tornado:
Figure 26: Tornado. Image from Encyclopædia Britannica, Inc.

12. Precipitation, Air Masses, and Fronts

Photo 23: A Thunderstorm in its developmental stage, Lacombe, Alberta. 2011-06-29


Cloud formation

The average cloud droplet has a diameter of 10 µm and a rain droplet 1000 µm (1mm). Cloud droplets are light and remain suspended in the air, or fall a short distance and are evaporated. A falling droplet is pulled by gravity and resisted by friction, when both forces equal each other a droplet is either suspended or falls at a constant speed. Larger droplets have greater terminal velocities.

Water condensates around small particles in the Atmosphere, creating droplets up to 20 µm. If droplets of various sizes exist in a warm cloud (above 0°C), collision-coalescence occurs due to colliding droplets and so forming larger precipitation droplets. Water in a cold cloud crystalizes, unless the water has no solid nucleus to form a crystal around, and then it will remain liquid even if the temperature of the droplet is below 0°C. Cold clouds (below 0°C) form in higher altitude areas. Precipitation from these clouds will often start as snow, and depending on the temperature conditions on the surface, will fall as rain or snow.

Thunderstorms

Thunderstorms are often created on hot days and have a short lifespan of only a few hours. Due to high surface temperatures, hot air will rise quickly, at speeds from 10 m/s up to 30 m/s. As the hot air rises, it also cools; cold air can hold less moisture than hot air, and therefore droplets will form. Due to the strong updraft of hot air, these droplets will continue rising. This is called the developmental stage. The Maturing stage occurs when enough raindrops from and fall to the surface to cause a cold downward draft. During this stage, the cloud still grows at the top and empties at the bottom. The final stage is the dissipating state. The cloud empties at the bottom and is sometimes dispersed at the top by upper air winds, creating a broad anvil like top. Photo 23 shows a developing thunderstorm on a hot day.


Photo 24: Orographic lifting, Rocky Mountains near Jasper, Alberta. 2011-05-19

Orographic lifting

Alberta has relatively low precipitation compared to British Columbia due to orographic precipitation that falls in the Rocky Mountains. Based on the concept that cold air can hold less moisture, Oceanic clouds that drift through the Rocky Mountains have to rise in order to go over the mountains. This rising process causes cooling. The windward slope of a mountain receives the precipitation and the leeward sides relatively little. Places like Kamloops in the interior of BC are relatively dry too, because they lay beyond the Coastal-Cascade mountain range. Oceanic clouds, moved westward by the Westerlies wind currents, empty partially in this mountain range and lower again on the leeward side, thus warming up and having more holding capacity for moisture. Once these clouds reach the second mountain range, the Rocky Mountains, they will largely empty. Therefore Alberta has relatively little precipitation compared to BC. Photo 24 shows clouds against the windward side of the Rocky Mountains.

11. Atmospheric Moisture and the Water Balance

The Hydrologic Cycle

Photo 21: Dried-up run-off river, Drumheller, Alberta. 2011-05-12
The Hydrologic Cycle is the cycle of water on Earth; the cycle by which water passes through water’s solid, liquid, and gas stages; as well as passing through the Hydrosphere, Atmosphere, Lithosphere, Cryosphere, and Biosphere. It is one of the most important cycles on our planet.

The main process is evaporation, in which water vaporizes above the oceans, which takes out the salt of the water and creates clouds; water then falls on the oceans and land in the form of precipitation. A second process is called transpiration by which water transpires into the Atmosphere through leafs. Water also evaporates from the land. These last two processes have the combined name: evapotranspiration. Evaporation and evapotranspiration together cause precipitation. Water from precipitation is absorbed by and transported on and in the surface of the earth. Transportation of water on the surface via rivers and streams is called runoff. Alberta has many seasonal runoff streams that are active in the spring but dry up in summer (photo 21).


Photo 22: Altocumulus Cloud, Edmonton, Alberta. 2011-05-10

Clouds

Clouds are an important part of the hydrologic cycle, they hold and transport water. Cloud-type classification is an important part of meteorology and climatology. There are 3 categories of clouds. Status clouds are layer like, thin, and cover a large area. Stratus clouds below 3km are called stratus clouds, between 3-6 km altostratus, and above 6 km cirrostratus. The second cloud type is the cumulus cloud, which looks like a puffy, thick, billowing mass that often develops at great heights. Depending on height, these clouds are called cumulus or stratocumulus (below 3 km), altocumulus (3-6 km), and cirrocumulus (above 6 km). Very large cumulus clouds are cumulonimbus clouds, extending from 500 m at the base to 12 km at the top. The third type is the cirrus cloud, which is very thing and wispy, streak-like clouds. These clouds occur at heights above 6 km. Often the term cirrocumulus and cirrostratus is used as well, to imply a combination.

Cloud classification is still a form of interpretation as clouds are never really the same. The image above (photo 22) is a cumulus cloud; however, cumulus clouds are often have more crisp edges and defined curves, this cloud has some of the streaky aspects of the stratus cloud. Estimating the height of the cloud at about 5km, I would guess this cloud can also be called altocumulus. 


10. Hydrosphere: Circulation of the World Ocean

Photo 19: Warm ocean currents in the Caribbean, close to Cancun, Mexico. 2008-12-18


Ocean Currents

To transport heat from the warmer Equatorial Regions (photo 19) to the cooler Polar Regions (photo 20), both Ocean currents (13%) and air movement (87%) are involved. However, the oceans currents near the Equator are actually more involved in heat movement and account for 25% of the total heat transfer in that area. Interestingly, most of the heat is transported in the upper 100 meters of ocean water at a speed of about 8 kilometers per hour. Ocean currents are caused by the frictional force of the wind, by the Coriolis force, by moving against and around landmasses, and by salinity differences (saltier water is heavier). 


Photo 20: Powerful Westerlies: A day on the beach in The Netherlands. 2009-05-17

North Atlantic Oscillation

Air and water flow is not so universal and has unique systems for various parts of the earth. El Niños affect the tropical climate and weather of the Southern Pacific. The North Atlantic Oscillation (NAO) is a similar phenomenon of the North Atlantic Ocean. It depends on how much warm water comes from the Gulf of Mexico and the Caribbean area, it depends on how much of this warm water makes it over to Northern and Central Europe, and it depends on the existence of the Icelandic low pressure system and the Bermuda High pressure system. When these conditions are in place, and they can sometimes endure for years, strong warm air Westerlies blow into Britain, France, The Netherlands (photo 20), and other European countries. If these conditions do not exist, cold air from Russia will enter this area of Europe.

9. Circulation Patterns of the Atmosphere

Photo 16: I'm trying to open an unripe coconut on a beach near Cancun, Mexico. 2008-12-14


Equatorial Low and Polar High


The two causes of air circulation on the Earth is unequal heating by the Sun and Earth’s spinning around its axis. The area from the equator to about 35° latitude north and south of the equator receives a surplus of heat respective to the area beyond that. Therefore, the heat transfer on the Earth occurs from the Equator outwards to the poles, creating an equatorial low pressure area (Inter-Tropical Convergence Zone) and a polar high pressure area. Air circulates from the poles to the equator occurs in the lower altitudes and from the equator back to the poles at higher altitudes in the Atmosphere. The ITCZ is the rainiest latitudinal region in the world, because as air rises it cools and can hold less moisture. This results in much lush green vegetation in the Caribbean area (photo 16).

Subtropical High and Upper Mid-Latitude Low

The cool wind from the poles that cooled off the equatorial area now returns to the poles at higher latitudes, but falls downward at about 30° latitude, forming the Subtropical High areas. These areas are most dessert like (south-western areas of the USA and northern Africa for example). The winds from these areas to the equator are called Trade Winds; the winds moving towards the poles are called Westerlies (because they come from the west in both Hemispheres). Winds from the poles, due to the Polar High, are called Polar Easterlies.  These two winds meet each other at the Polar Front, an area of convergence at 60° latitude called Upper Mid-latitude Low. This is a conceptualized model; in reality many other factors play a part in the circulation patterns of the Atmosphere. In Alberta we experience much Westerlies, wind coming from the Pacific Ocean over the Rocky Mountains. This brings precipitation as rain in the summer and snow in the winter (photo 17).


Photo 17: My first experience with large amounts of snow on my birthday. 2006-02-28

Figure 18: A Model of Atmospheric Circulation, added to this post to accompany the text with added clarity. Image from  Encyclopædia Britannica, Inc.

8. Air Pressure and Winds

Photo 14: A barometer. 2011-06-29

Atmospheric Pressure

The Atmosphere is held against the earth by the force of gravity, which creates a pressure. Air pressure is generally measured in millibar (mb).  Standard sea-level air pressure is 1013.25 mb. Italian scientist Evangelista Torricelli (1608-1647) measured air pressure with an upside-down glass tube filled with mercury in a dish of mercury. The height of the mercury column in the tube measured air pressure on the mercury in the dish. The mercury was prevented from flowing out of the tube by a vacuum in the tube above the mercury.

Later scientists discovered that air pressure decreases with altitude gain.  However, air pressure also measured the flow air in the atmosphere; it could measure high and low pressure areas. And it could thus be used in the prediction of weather (photo 14), because air pressure often changes before the weather does.


Photo 15: Wind and rain meter, Lacombe, Alberta. 2011-06-29

Pressure-Gradient Force

Wind results from a horizontal difference in air pressure, air moves from high pressure areas to low pressure areas. This is called the pressure-gradient force. The Sun heats different parts of the earth at different times, and thus the Sun is often the driving force of winds.

Coriolis Force

The Coriolis force causes moving air to spin in a circular pattern, caused by the rotating of the Earth. Air is deflected to the right in the Northern Hemisphere and to the left in the Southern Hemisphere. The Coriolis force is strongest near the poles and weakest near the equator. The Coriolis force works strongest on large bodies of water and air. The popularized rotating water in the toilet bowl is not necessarily caused by the Coriolis force because shape and movement of the water in the toilet may be of greater affect to the water’s rotational direction than the Coriolis force.

Frictional Force

Another factor with air movement is the frictional force, which causes air close to the Earth’s surface to slow down due to friction.

Measuring Air Movement

Wind measurement is an important part of cloud movement, evaporation, and weather prediction. At our farm we measure air direction and force, as well as rain and temperature levels (photo 15). This data is analyzed by a computer, which regulates the opening and closing of the life stock barn walls. The ideal is as much ventilation as possible until temperature reaches below 0°C. The system also watches for rain blowing into one side of the barn, on which it will close that side of the wall.

7. Atmospheric and Surface Temperature

Photo 12: A thermometer. 2011-06-29

History of temperature measuring

Temperature measurements started already in the latter part of the 1800s with British scientist James Glaisher who traveled up into the troposphere with his balloon, and almost killed himself that way. Temperature is really the measurement of kinetic energy, the speed at which molecules move. Temperature is measured with a thermometer.

Celsius

Celsius is the most common scale for temperature. Swedish astronomer Anders Celsius (1701–1744) used the expansion rate of mercury and set the freezing point of water at 0°C and the boiling point at 100°C.

Fahrenheit

The Fahrenheit scale is used in the United States. Dutch-German-Polish physicist Daniel Gabriel Fahrenheit (1686–1736) used the expansion rate of alcohol, setting the freezing point of water at 32°F and the temperature of a horse at 100°F or 37.8°C.

Kelvin

The Kelvin scale is the modern scientific scale, also following the expansion rate of mercury like the Celsius scale. The Kelvin scale labels the freezing point as 273°K and 0°K is conceptually the absolute zero point at which molecules stop to move. (Remember, temperature is kinetic energy, the movement of molecules.) Photo 12 displays a normal mercury thermometer with Celsius and Fahrenheit scales.


Photo 13: Downtown Calgary, the day before the Calgary Parade. 2010-07-09

Urban Dust Dome

A modern issue in regards to temperature is the phenomenon called Urban Dust Dome and Urban Heat Island. The heat island is caused due to a combination of high levels of fuel combustion and absorbed heat in concrete buildings and asphalt roads. The dust dome is created by warm air circulation that creates a dome from which city dust does not escape. Warm air and small particles rise in the centre of a city as the air is heated, above the city this hot air enters lower pressure area and disperses, the dust particles slowly drift towards the edges of the city, the air at the edges of the city is sucked back into the city because of the low pressure area due to the rising air, thus creating a cycle called urban dust dome. Photo 13 displays a perfect example of the heat island/dust dome effect: human activity combined with a concrete environment.

5. Composition and Structure of the Atmosphere

High altitude in the Kananaskis in the Rocky Mountains of Alberta, from which I could see Calgary from 70 km away. 2010-07-27


Lower Atmosphere

The Earth’s atmosphere consist of two main regions, the Homosphere up to about 800-100 km above the surface and the Hetrosphere above that. The Homosphere is where we live in and it has a mostly uniform chemical composition divided into 3 categories: constant gasses (Nitrogen 78%, Oxygen 21%, Argon 1%, Neon, Helium, and Hydrogen), variable gasses (Water 0-4%, Carbon Dioxide 0.04%, Methane, Nitrous Oxide, and Ozone), and impurities (aerosols, dust, smoke, and salt crystals).

Higher Atmosphere and Ionosphere

The Atmosphere’s Homosphere consists of the Troposphere (from the surface up to about 12 km), the Stratosphere (10-50 km), and the Mesophere (50-80 km). The Hetrosphere contains of the Atmosphere’s Thermosphere (80-500/1000 km) and Ionosphere’s D, E, and F regions. The Ionosphere serves as important blocker of sun-rays as well as for satellite communication.

Temperature and altitude

In the Troposphere, the temperature lowers with an average of 6.5°C per 1000m. Photo 10 above is during one of my favourite activities of the summer: trail riding in the Rockies. The view from these places is great, and was temperature change is definitely noticeable here on this 2-3 km high mountain top. GPS devices are particularly fun for these kinds of activities, because they record elevation.


Cherry Tree as part of the Earth's Nitrogen and Carbon Cycle, Lacombe, Alberta. 2011-05-29


Earth’s Cycles

The Earth’s atmosphere was formed during its early stages of development from gasses expelled by volcanoes and the hot surface of the earth. This reached a state of dynamic equilibrium, a state in which the overall composition of the earth system is in balance; however, the individual parts of the system change. There are four cycles acting between the troposphere and the lithosphere, hydrosphere, and biosphere. The hydrologic cycle circulates the water (unit 11), the oxygen cycle supplies the atmosphere with oxygen via photosynthesis and extracts it via inhaling, the nitrogen cycle involves the biosphere and extraction of nitrogen from the atmosphere to convert it into organic protein for consumption, and the carbon cycle cycles carbon dioxide from air into the oceans, to be decomposed by plankton. The carbon cycle also occurs in the biosphere (photo 11), where plants absorb carbon dioxide during photosynthesis and release it during respiration and decay.

4. Earth's Setting in Space


The Universe

In that big totality called the university is a Local Supercluster, and in that Local Supercluster is a Local Galaxy Group. Somewhere in that is our Milky Way galaxy. Tugged into a corner of that Galaxy is our Solar system and within that, a Planet named Earth, our home. The known universe is about 28 trillion light-years in diameter, simply because that’s how far we can look into space right now.

A light-year is the distance light travels in a year, which is 9.46 trillion kilometers. This is enormous and very hard to grasp. Photo 8 below shows an image I took with my own digital Camera. It has a maximum shutter speed opening of 15 seconds and and ISO maximum of 1600, yet it was very hard to get a good image on this night where the sky was very clear. It does show the multitude of stars in the sky.

Photo 8: Stargazing with my Canon PowerShot SX10 IS. 2010-09-11


The Solar system

The Milky Way Galaxy formed about 12 billion years ago, our solar system 4.6 billion years ago. Our solar system has one sun, as opposed to a binary system, which has two suns. Earth is part of four terrestrial planets; the other ones are Mars, Venus, and Mercury. The four outer planets are the gas giants Jupiter, Saturn, Uranus, and Neptune. The Sun accounts for 99.8% of the total mass of our solar system. Of that 0.2% planetary matter, 99% is in the outer four gas giants, also called major or Jovian planets. Therefore, 0.002% of our solar systems matter is contained in the four inner planets. This means that the Sun is gargantuan compared to earth, located 149.6 million kilometers away from the Sun.


Planet Earth

The planets rotate around the Sun, not in a circle, but in an elliptical shape, being sometimes father away (aphelion) and other times closer to the Sun (perihelion). There are many things that can be said about the Earth’s rotation around the Sun.  One thing I would like to highlight is the Earth’s yearly Axis Tilt, which makes the sun seem higher in the sky in summer (photo 9) and lower in the winter. This creates our four seasons and the phenomena we know as Summer solstice (longest day) on 22 June, Winter solstice (shortest day) on 22 December, Vernal equinox on 21 March, and the Autumnal equinox on 23 September.

Photo 9: Sun angle a little after the noon hour, a week after summer Solstice, Lacombe, Alberta. 2011-06-28

3. Mapping the Earth's Surface

Photo 6: This is a 1767 map of my native area in Holland called "Alblasserwaard," highlighting towns and cities, townships, and the local nobility. The red Coat of Arms with the 3 arrows on the top left and bottom right are supposedly my ancestors. Most importantly this image shows that Cartography is both an art and a science. 2011-06-27


Cartography

Humans have been making maps of the Earth for a long time, the earliest records date back to 2500 BCE to a clay tablet from the Mesopotamian world. This was more a diagram outlining the most important features than a detailed map of shape, area, and scale/distance. Cartography is the art and science of map making. That this is an art is visible in photo 6 above.


Map Projections

Besides different maps for different functions, maps do not all look the same depending on the type of projection used. Cylindrical projection is most common and known as Mercator projection. This type is most accurate around the equator and the two tropics and least around the poles. Other map projections are conic projection, planar projection (used for the poles), and equal-area projection. All projection types are strong at one or two of the variables of shape, area, and scale, and weak at the others. Mercator is not good for accurately displaying area, because Africa often looks too small compared to North-America; nor is it good for displaying scale/distance, because flying from London to Toronto looks like a curve on the map and is a straight line in reality. Maintaining angels and shape is what Mercator projection is popular for today.


Photo 7: A globe. 2011-06-27


Longitude and Latitude

The most accurate projection of the Earth is on a globe, as in photo 7 above. A Globular projection of Earth is divided into north-south lines called meridians and east-west lines called parallels. The starting point for meridians is the Prime Meridian in Greenwich, Great-Britain, and for the parallels it is the equator. Distances can be measured in the degrees (°), minutes (`), and seconds (“) relative east or west of the Prime Meridian and north or south of the equator. This system is utilized by most Global Positioning Systems (GPS). Edmonton`s coordinates are 53°34′N 113°31′W.


Other coordinate systems

Besides Longitude and Latitude, there are a few other systems that can be used to define ones location on Earth. During medieval times this was the Stereographic coordinate system. A modern system developed by the military during the cold war was the Universal transverse Mercator spatial coordinate system. Locally, the Dominion Land Survey system has been used in most of western Canada to divide the land into sections of 1 square mile.


Saturday, June 25, 2011

2. The Planet Earth

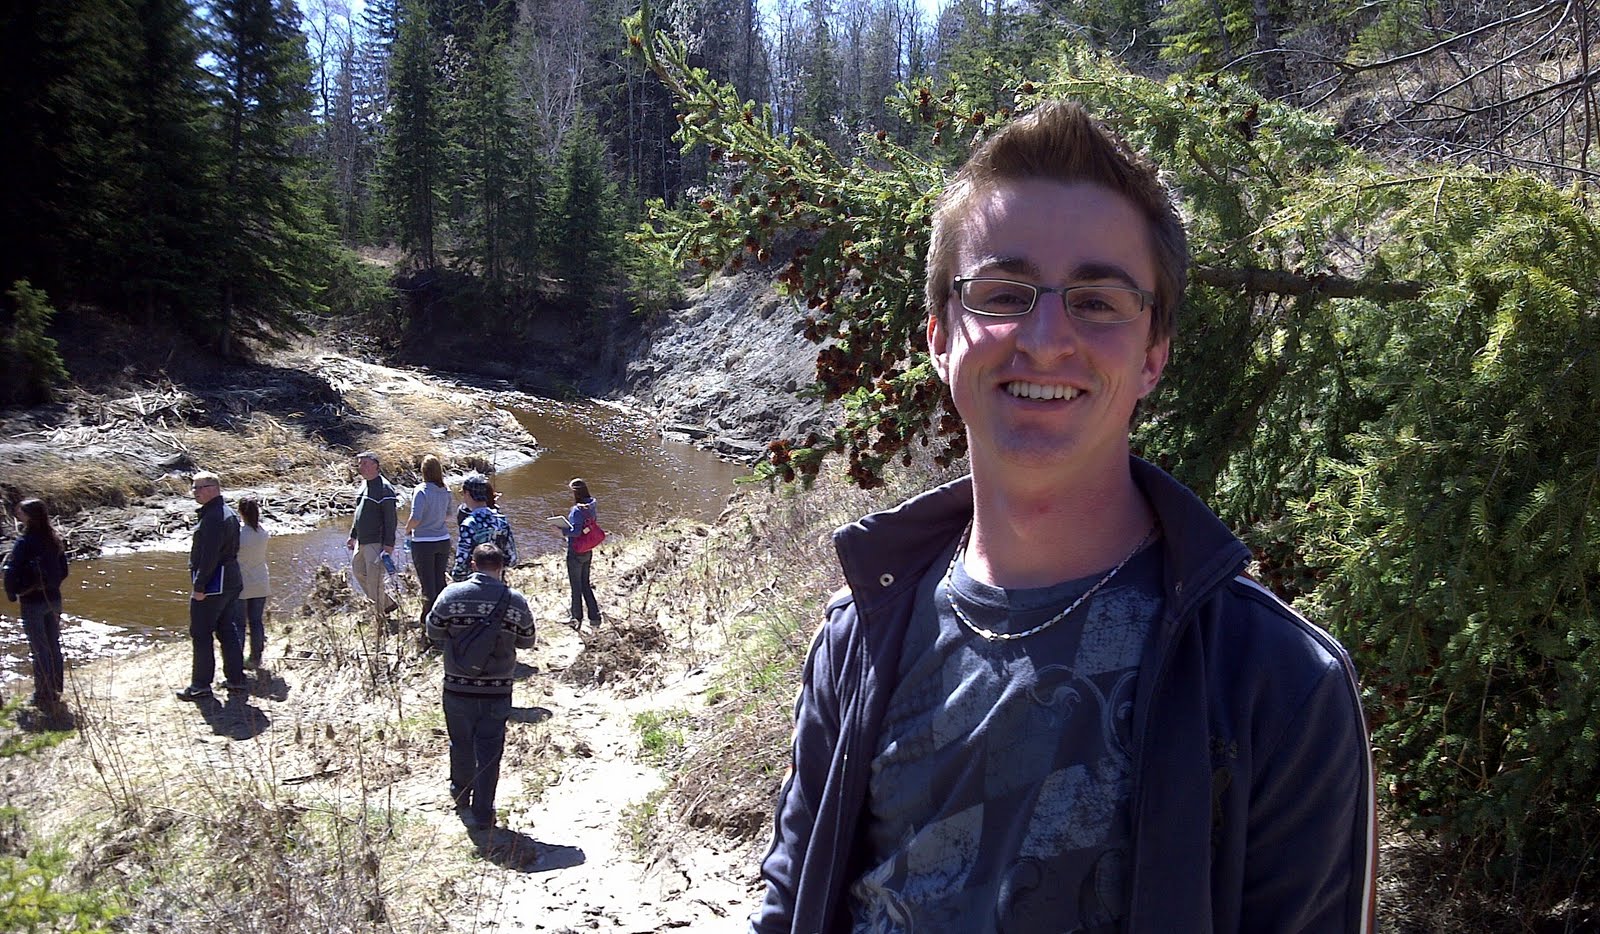
Photo 4: King's University's Geography 201 field trip to Whitemud Creek, Edmonton, Alberta. 2011-05-04

Earth System

The Earth consists of five interacting spheres, five facets of the larger Earth System. In the image above (Photo 3), we see four of the five spheres. The atmosphere begins a few meters within the soil and oceans up to about 60,000 km above the Earth, forming a blanket of air around the earth that regulates the weather patterns. The lithosphere (lithos means rock) is the solid outermost layer of the Earth, consisting of land, mountains, and seafloors. The hydrosphere contains all the water bodies on the Earth. The biosphere refers to animal, plant, and human life. Not in this photo is the cryosphere, the frozen water on the Earth, including glaciers, floating ice, snow cover, and permafrost. The cryosphere has its own distinct properties and is thus regarded as separate from the other four, even though most of this sphere could be counted within the hydrosphere. The key for understanding here is that these systems interact and influence each other. Understanding each sphere and how they affect each other is a main theme is physical geography.


Photo 5: My father and I at a beach in western France. 2005-07-07

The continents and oceans


Earth has 6 so called continental landmasses making up 29% of the earth’s surface: Africa (30,300 km2), South America (17,870 km2), North America (24,350 km2), Eurasia (54,650 km2), Australia (8,290 km2), and Antarctica (13,990 km2); as well, our planet consists of 71% water and ice and has 5 main oceanic bodies: the Pacific, Indian, North Atlantic, South Atlantic, and the Southern Ocean around Antarctica. Smaller water bodies include the Arctic Ocean and the Mediterranean Sea. 

The picture above is on the beach of western France, looking out over the North Atlantic Ocean. Percentages and numbers make the world sound small, but I always find that a visit to the beach, like here in France, puts these numbers into perspective. Compared to our human size, the Earth is breathtakingly large. Not all the Earth’s land is livable, so the area in which permanent residence is possible is called the ecumene. 

The Oceans dividing the land are not just big water basins but have unique and different regions: the continental shelf is the gently sloping extension of landmasses into oceans that reaches up until the continental slope, at which the ocean becomes much deeper quickly, continental rises are often at the foot of these slopes and have again a much gentler downward slope, at the bottom of the ocean floor are the relatively flat abyssal plains with occasional deep trenches, and at the meeting of some of the continents there are the mid-oceanic ridges full with volcanic activity and marine wildlife.


1. Introducing Physical Geography

Photo 2: King's University history trip to Eastern-Europe. Humboldt University, Berlin, Germany. 2011-06-06

Eratosthenes

The Greeks were the first to organise the world around them into two fields of study: cosmography (study of skies, stars, etc.) and geography (study of the terrestrial world). It was a student of Aristotle, Eratosthenes (c. 275-195 BCE), who is considered the first geographer and coined the term geography. Geo means Earth and graphia means description: geography is the description of the Earth. Eratosthenes is very famous for his remarkably accurate calculation of the circumference of the earth (geodesy), as well as for his concepts on the Earth’s environmental zones (hot equator, cold poles, and temperate zones in between). This was remarkably advanced for that time when some still believed the earth was flat.

Alexander von Humboldt

Physical geography is a major subfield of geography. During the age of exploration (1500s), the discovery of the new world started more or less with Columbus and continued for a few centuries. Sir Francis Bacon (1561-1626) introduced the scientific milestone: The Scientific Method, which defines (scientific) truth by the testing of hypotheses. Alexander von Humboldt (1769-1859) was one of the greatest scholars of these times. He traveled 3000 km on the previously uncharted Orinoco River in northern South-America, as well as to Ecuador, Peru, Mexico, Cuba, and the United States. Later he also traveled to Russia and remote areas of Siberia. He is famous for his six-volume book series named Cosmos, a collection of his observations regarding soils, vegetation, animals, oceans, and atmosphere. This was a very important scientific achievement of the nineteenth century. My recent travels took me to Berlin, where I biked past the Humboldt University (Photo 1), named after the German brothers Alexander von Humboldt the geographer and Wilhelm von Humboldt the philosopher and politician.

Charles Darwin

Another explorer of Humboldt’s time was Charles Darwin (1809-1882), who had studied natural history, and traveled at the age of 22 to the South American coastline for five years on the H.M.S. Beagle. At age 28, he concluded that species change gradually, what he called “transmutation.” Twenty-two years later he published his famous scientific milestone On the Origin of Species. The image below (Photo 2) displays replicas of some of Darwin’s research instruments.


Photo 3: Darwin's research instruments at the Royal Tyrrell Museum, Drumheller, Alberta. 2011-05-12